Our problem was to figure out how position of an object relates to time.
Independent Variable: Amount of time the buggy has driven
Dependent Variable: Position of the buggy
control: buggy velocity, room climate, surface driven on, and timer used
Method for collecting data: We collected data by running 4 tests and during each test marking the position of the buggy after 2, 4, 6, 8, and 10 seconds have passed then recording the buggys position at each of these time intervals.
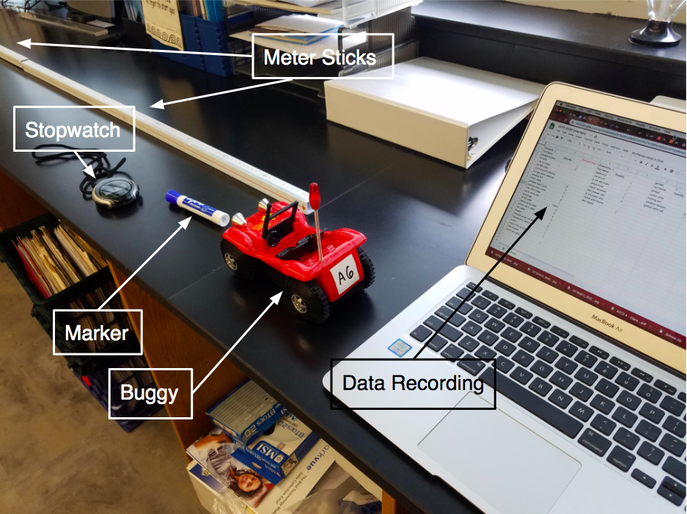
Procedure: Our procedure began with setting up 2 meter sticks alongside the track the buggy would drive. then after starting the buggy we would begin a stopwatch and at 2, 4, 6, 8, and 10 seconds on the stopwatch we would place a mark using an expo marker on the track next to the location of the buggy at that time. then after concluding the test we would record the distance from the start line each mark is and create a table of the distances with their respective time intervals.
Diagram of Lab Setup:
Independent Variable: Amount of time the buggy has driven
Dependent Variable: Position of the buggy
control: buggy velocity, room climate, surface driven on, and timer used
Method for collecting data: We collected data by running 4 tests and during each test marking the position of the buggy after 2, 4, 6, 8, and 10 seconds have passed then recording the buggys position at each of these time intervals.
Procedure: Our procedure began with setting up 2 meter sticks alongside the track the buggy would drive. then after starting the buggy we would begin a stopwatch and at 2, 4, 6, 8, and 10 seconds on the stopwatch we would place a mark using an expo marker on the track next to the location of the buggy at that time. then after concluding the test we would record the distance from the start line each mark is and create a table of the distances with their respective time intervals.
Diagram of Lab Setup:
Recorded Raw Data:
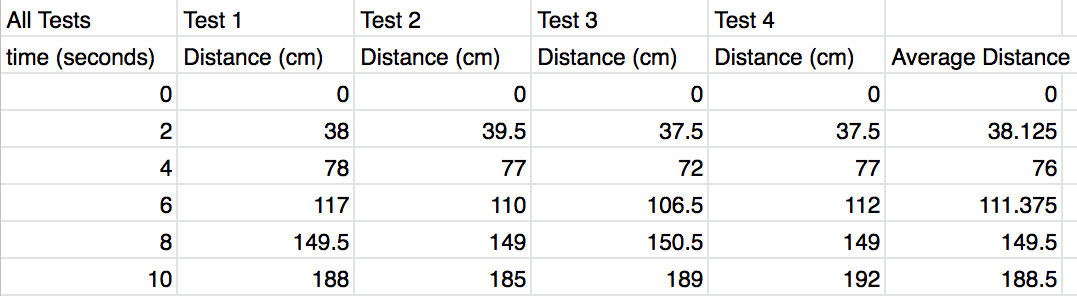
Processed Raw Data: One way the data was processed was in finding the average distance at each point above by using excel tools to divide by the amount of tests thus finding the average. This average was then plotted on desmos and a function of distance x in terms of time t was derived from it
function: x = 18.77t
Graphed Data: Position Over Time:
function: x = 18.77t
Graphed Data: Position Over Time:
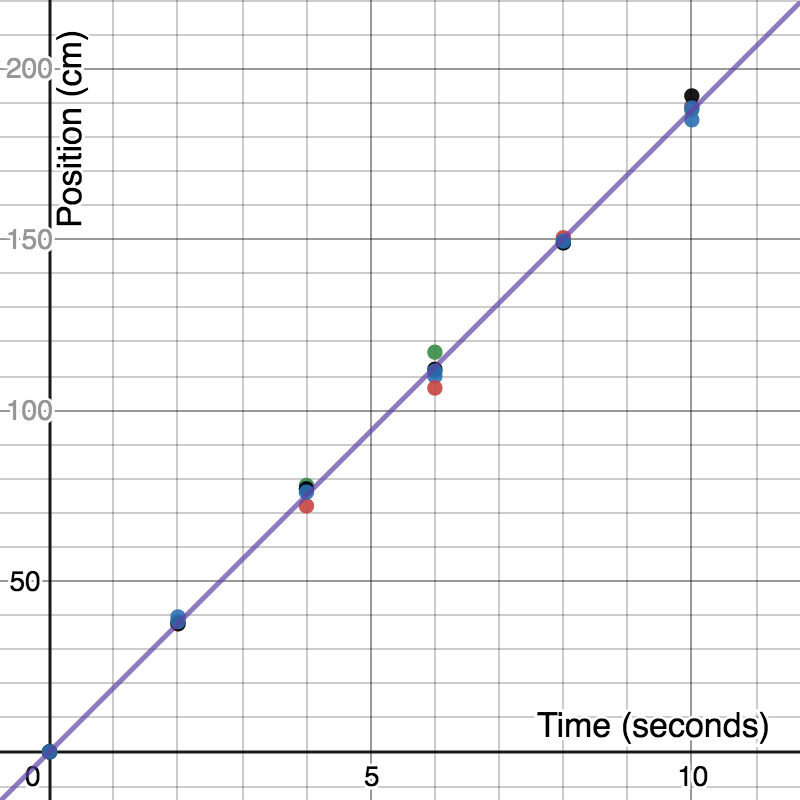
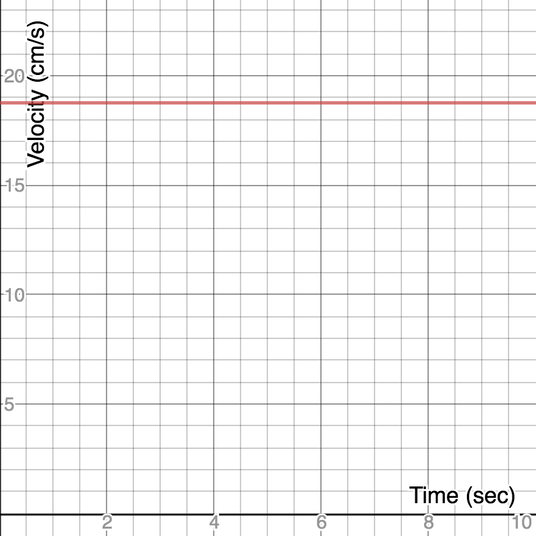
The slope of the linear best fit line is important as it shows the velocity of the car which in this case is roughly 18.77 cm/s
Velocity Over Time:
Velocity Over Time:
Connection of Evidence too Conclusion: The data in collected in this test proves the relationship of position in terms of time is the equation x = v * t and using the velocity and time from the lab the position can be closely calculated. This equation showing the relationship between position and time is extremely impost and can be used to determine velocity, distance or time of a object with a constant velocity as long as 2 of the 3 variables are known.
Conclusion: Using the data gathered during this lab we can determine that how position is related to time. The position of an object is determined by the object's velocity multiplied by the time that the object has been traveling at that velocity. This means if an object has a constant velocity and we now the time we can find the position or if we know the object's position we can find the time.
Evaluating Procedures: The first main source of uncertainty was the reaction time of the person marking the position and the person calling out the time from the stopwatch. This will always limit how certain the data can be as reaction time is never consistent. The second source of uncertainty is between how closely together the car and stopwatch were started. This also has to do with reaction time and creates uncertainty due to how you can't start the car at the same time as the stopwatch the same every time. A third source of uncertainty is how you mark the location of the vehicle. THis mark especially when trying to limit reaction time can be very imprecise and the range of amount off can vary heavily.
Improving the Investigation: One massive improvement that would limit much of not all of the uncertainty would be using a motion sensor instead of timing and marking by hand and would eliminate the issue of reaction time entirely. If i were to redo this lab I would choose this method instead due to how it eliminates nearly all uncertainty and provides much more data points.
